

35 Homes for Every 100 Families. The Number That Explains Everything About Workforce Housing.
The NLIHC Gap Report measures the most comprehensive picture of housing affordability in America. The finding: for every 100 extremely low-income renter households, only 35 affordable and available homes exist. The national shortage is 7.2 million units. This is not a cyclical housing problem. It is the structural demand signal underneath every workforce housing investment in the country.
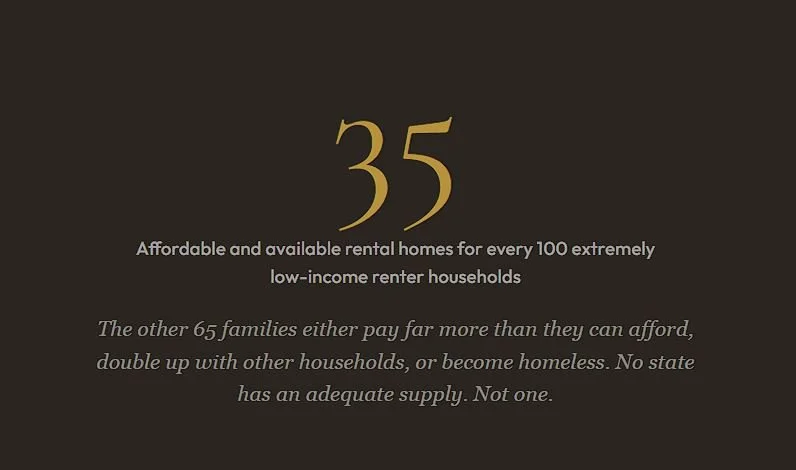
We have spent the past several months covering the forces shaping real estate capital markets: AI infrastructure, private credit stress, office conversions, the ROAD Act, construction data, and lending dynamics. Each of those stories is important. But none of them explains why workforce housing demand is structural rather than cyclical. This issue does.
The NLIHC Gap Report, published annually, is the most comprehensive measurement of affordable housing supply in the United States. It uses American Community Survey data from the Census Bureau to quantify something that most investors sense but rarely see measured: exactly how many homes exist, at what price, for which income levels, in every state and major metro in the country.

74% Spend More Than Half Their Income on Rent
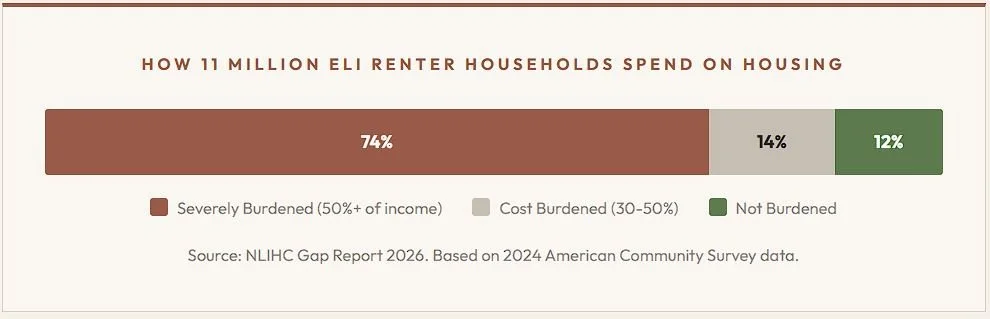
When a household spends more than half its income on housing, the consequences are specific and measurable. They cannot afford food, healthcare, transportation, or childcare at adequate levels. They are one unexpected expense, a car repair, a medical bill, a job disruption, away from being unable to pay rent. They do not have savings. They do not have a financial cushion. They are structurally trapped.
“The rent gets paid not because the economy is strong. It gets paid because 65 out of 100 families at the bottom of the income ladder have nowhere else to go. That is the demand signal underneath every workforce housing investment in the country.”
Measurable. Non-Discretionary. Structural. Concentrated Where IGC Operates.
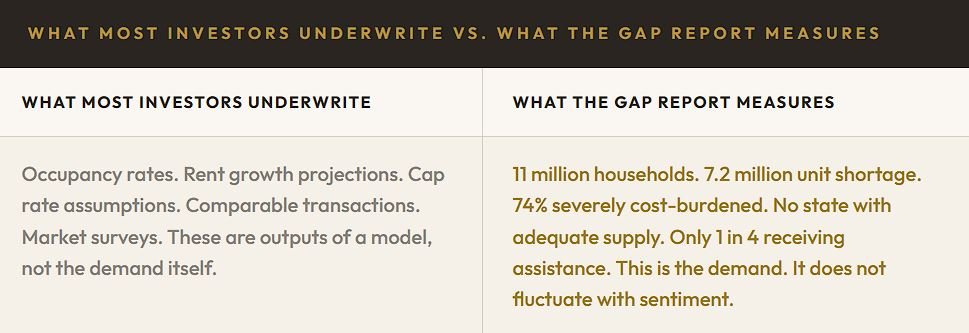
Every investment thesis depends on a demand assumption. The question for any allocator is: what makes you confident the demand is real, durable, and non-discretionary? The Gap Report answers that question with a precision that few other asset classes can match.
The demand is measurable. 11 million households. 7.2 million unit shortage. 35 available homes per 100 families. These are not projections or models. They are counts from Census data.
The demand is non-discretionary. People need a place to live. Unlike software subscriptions, enterprise contracts, or consumer discretionary spending, housing demand does not disappear during a downturn. It shifts. Renters who lose income do not stop renting. They move to more affordable options if they can find them.
The demand is structural, not cyclical. The shortage has persisted and deepened over more than a decade of underbuilding. It was not created by a single policy or rate cycle. It will not be resolved by one either.
Existing Workforce Housing Becomes More Valuable Every Year
America is building apartments. Permits are up. Construction pipelines exist. But the overwhelming majority of new construction targets higher-income renters. The permitting data we covered last week showed Durham at 45.2 units per 10,000 residents and Columbia at +468% year over year. Nearly all of that is Class A product at the top of the rent spectrum.
Construction costs make it economically impossible to build new housing at price points that extremely low-income renters can afford without subsidy. Land, labor, materials, insurance, and financing costs establish a floor that exceeds what the lowest-income households can pay. The private market responds by building for higher income levels where the math works.
The result: existing workforce housing, the Class B and C apartments already in the market, becomes more valuable with every passing year because no new supply is arriving to compete at that price point. The tenant renews because there is nowhere else to go. The occupancy holds because the alternative is not a better apartment. It is doubling up, severe cost burden, or homelessness.
Four Signals from the Gap Report
-
Only 35 affordable and available rental homes exist for every 100 extremely low-income renter households. The national shortage is 7.2 million units across 11 million households. No state has adequate supply. This is the foundational demand data for workforce housing.
-
74% of the lowest-income renters are severely cost-burdened, spending more than half their income on housing. They represent nearly one in four of all renters and 68% of all severely cost-burdened renters. The demand is not marginal. It is structural.
-
The market is building, but not for the people who need it most. Construction economics make new workforce-priced product unviable without subsidy. Existing Class B and C housing becomes more valuable every year because no new supply competes at that price point.
-
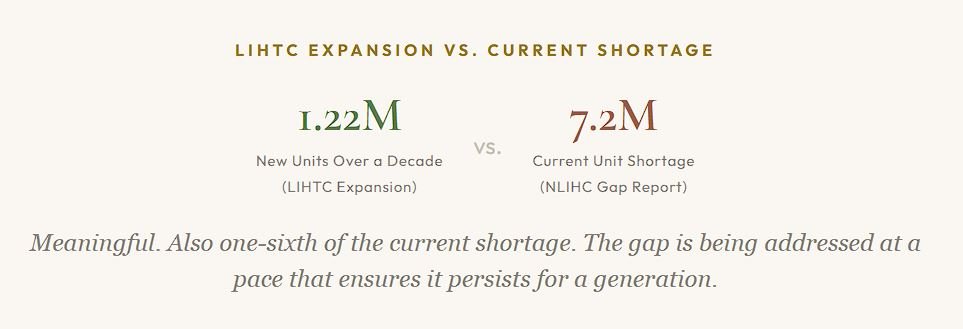
LIHTC expansion will finance 1.22 million units over a decade. That is meaningful but one-sixth of the current shortage. The gap persists structurally, ensuring that existing workforce housing with non-discretionary demand remains the most durable segment of the rental market.
The Number That Explains Everything
Every newsletter we publish connects to this data set. The frozen housing market. The construction pipeline gap. The ROAD Act. The debt divide. Private credit stress. Each one is a story about capital allocation. This one is the story about why the capital matters.
At IGC, we invest in the housing these families actually live in. Not the housing being built for them someday. The housing that exists today, in the markets where the shortage is deepest, at the price points where the demand is most non-discretionary.
“35 homes for every 100 families. That number explains why workforce tenants renew, why occupancy holds through cycles, and why the thesis is structural rather than cyclical. It is not getting smaller.”